IELTS Academic Writing Task 1 Sample Line Graph
Below, you will find a sample answer to an IELTS Academic Writing Task 1 question. The task features a line graph illustrating the number of tourists who visited a European town each month in 2022 and 2023. This sample response demonstrates how to describe trends over time clearly and accurately, using a range of vocabulary and grammatical structures suitable for a high band score. You can use it to study how to organise your ideas, highlight key comparisons, and maintain a formal tone throughout.
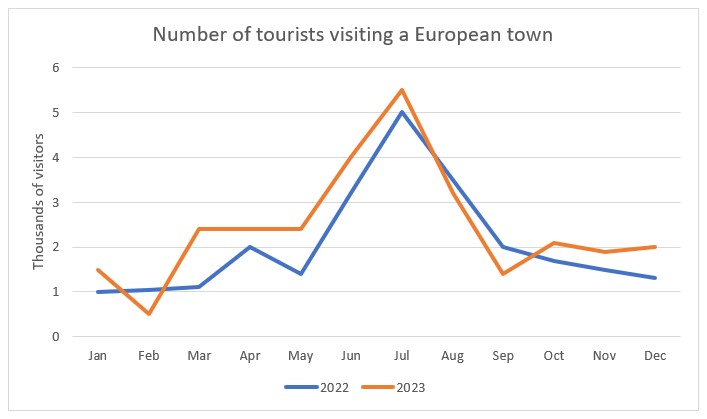
The graph below shows the number of tourists who visited a European town each month in 2022 and 2023.
Summarize the information by selecting and reporting the main features, and make comparisons where relevant.

The line graph compares the number of tourists (in thousands) who travelled to a European town over the course of 2022 and 2023.
In 2022, the number of visitors remained steady at around 1000 during the first two months. Then, it rose modestly, reaching a high of 2000 in April, followed by a slight dip to approximately 1400 people in May. From that point onwards, the figure increased sharply, peaking at 5000 in July. Afterward, the number of tourists fell significantly, ending the year at just over 1000.
In January 2023, the town attracted approximately 1500 tourists. However, this figure dropped sharply to a low of 500 in February. Subsequently, visitor numbers surged steeply to around 2500 in March and remained fairly constant over the following two months. This was followed by a pronounced increase, reaching a peak of 5500 tourists in July. Between July and September, the number of visitors fell dramatically by about 5000. Despite minor fluctuations thereafter, visitor numbers stabilized and remained steady until the end of December.
Overall, tourist arrivals followed a similar seasonal trend across both years, with significant peaks in the summer months and lower, more stable figures during the rest of the year.