IELTS Academic Writing Task 1 Sample Pie Chart & Table
Below, you will find a sample answer to an IELTS Academic Writing Task 1 question based on two pie charts and a table. This sample response demonstrates how to effectively describe and compare visual data, highlight significant trends, and use a wide range of academic vocabulary and grammatical structures. You can study this example to understand how to organize your writing, report key features clearly, and achieve a high band score in the IELTS Writing Task 1.
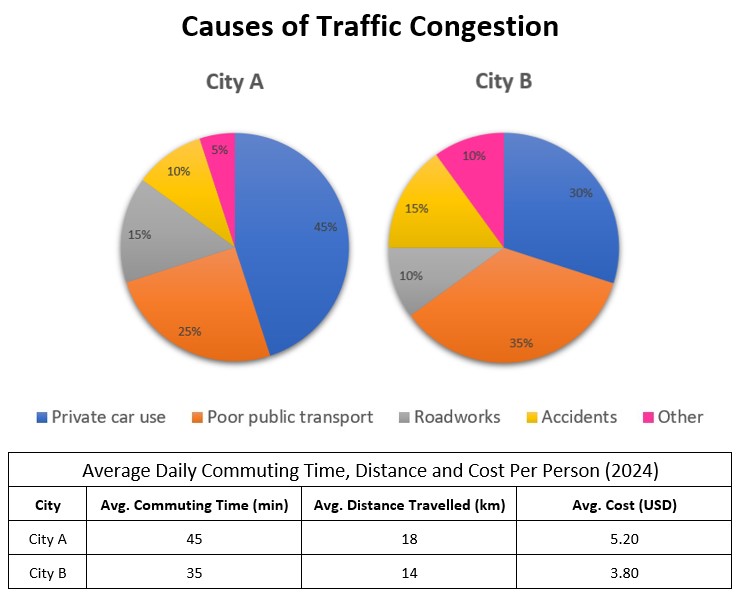
The charts below show the main causes of traffic congestion in two U.S. cities in 2024. The accompanying table outlines the average daily commuting time, distance and cost for a person living in those cities.
Summarize the information by selecting and reporting the main features, and make comparisons where relevant.

The pie charts illustrate the primary causes of traffic congestion in two American cities in 2024, while the table provides data on the average daily commuting time, distance, and cost per person in the same year.
It is immediately apparent that private car use was the leading cause of traffic congestion in city A, accounting for 45% of all cases. In contrast, poor public transport was the most significant contributor in city B, responsible for 35% of congestion, followed closely by private vehicle usage at 30%. Roadworks and accidents were also contributing factors in both cities, though to varying extents. Notably, “other” causes represented the smallest share in each city, at just 5% in city A and 10% in city B.
Turning to the table, commuters in city A spent more time and money traveling each day. The average commuting time was 45 minutes, compared to 35 minutes in city B. Similarly, the average distance travelled per person was greater in city A (18 km) than in city B (14 km). Consequently, the daily cost of commuting was also higher in city A, at $5.20 per person, whereas in city B it stood at $3.80.
Overall, private car use and inadequate public transportation emerged as the dominant factors in both cities. In addition, city A experienced longer, more expensive daily commutes than city B.